Metabolic syndrome is one of those diagnoses that hides in plain sight. Each piece — a slightly high blood pressure, triglycerides at the upper edge, a waist that’s crept out — looks minor on its own and gets a shrug. But together they form a cluster that sharply raises your risk of heart disease and type 2 diabetes. The power is in the pattern.
The stat most people don’t know
Roughly 1 in 3 US adults meets the criteria for metabolic syndrome (estimates generally land around 25–35%), and prevalence climbs past 40% in adults over 50 (NCBI review). Most don’t know they have it — because no single finding sets off an alarm, and the diagnosis only appears when someone looks at all five together.
The 5 criteria (you need any 3)
Per the widely used NCEP ATP III definition, metabolic syndrome is three or more of (NHLBI; NCBI):
- Abdominal obesity — increased waist circumference (roughly >40 in men, >35 in women)
- Triglycerides ≥150 mg/dL
- Low HDL — <40 mg/dL (men) or <50 mg/dL (women)
- Blood pressure ≥130/85 mmHg
- Fasting glucose ≥100 mg/dL
Three of five is the threshold. Notice how many are on a standard lab panel — the lipid numbers and fasting glucose are usually right there; they just aren’t tallied against these cutoffs.
The engine underneath: insulin resistance
Four of the five markers are downstream of the same driver — insulin resistance. High insulin promotes central fat, raises triglycerides, lowers HDL, and nudges glucose up. That’s why the triglyceride-to-HDL ratio and HOMA-IR are such useful early reads: they catch the engine before enough gauges cross their thresholds to formally “count.”
Why it’s worth tallying
The danger of metabolic syndrome is precisely that it’s a set of individually-ignorable findings. Tallying them turns five shrugs into one clear, actionable picture — and the same lifestyle changes that reverse prediabetes (modest weight loss, activity, fewer refined carbs) can move several markers back below threshold at once.
The cluster also travels with problems that sit outside the five criteria. Raised uric acid and gout turn up disproportionately in people who meet them, early kidney markers often drift before anything hurts, and CRP adds the inflammatory dimension the tally leaves out. If you’re already counting criteria, those three are worth a look on the same report.
What this looks like in Bevita
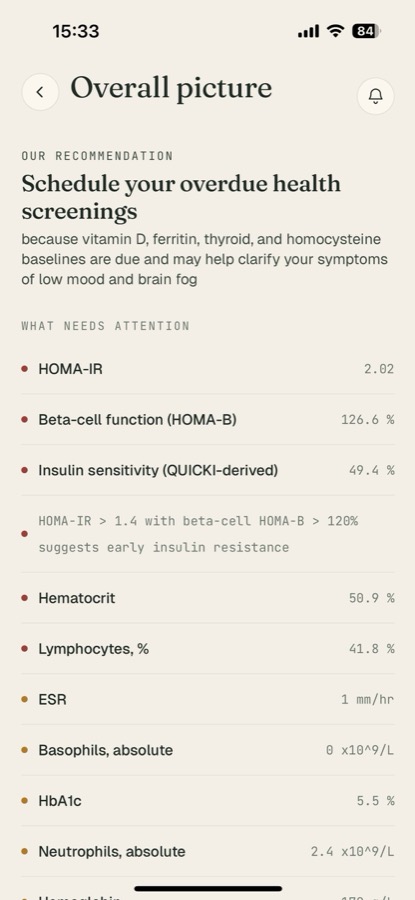
This is exactly what a tool like Bevita is for — reading markers together instead of as isolated values. On this “Overall picture” screen it surfaces the metabolic cluster (HOMA-IR, HbA1c, and related markers) and interprets it in plain English rather than leaving five separate “borderline” numbers scattered across a report. It tracks each against its threshold over time, so you can see whether you’re drifting into — or back out of — the syndrome.
What to do
- Get the full picture — a lipid panel, fasting glucose (ideally + insulin), plus your blood pressure and waist measurement.
- Tally against the five thresholds — three or more means metabolic syndrome.
- Target the engine — the lifestyle changes for insulin resistance move multiple markers at once.
- Track and re-test, and work with a clinician on priorities (blood pressure and lipids may need their own attention).
References
- National Heart, Lung, and Blood Institute (NHLBI). Metabolic Syndrome.
- Comparative Analysis of Metabolic Syndrome Diagnostic Criteria. NCBI / PMC.
- Centers for Disease Control and Prevention. National Diabetes Statistics Report.
This article is for education and isn’t medical advice. Discuss your results with a qualified clinician.
Track the whole cluster with Bevita
Metabolic syndrome only makes sense when its five markers are read together and over time. Upload your labs to Bevita and it surfaces your metabolic markers as one picture, flags what’s crossing threshold, and tracks the trend. Download Bevita, upload your bloodwork, and see the pattern before it becomes a diagnosis.