Insulin resistance is one of the most common metabolic problems there is — and one of the most quietly missed. It can develop for a decade before it ever shows up as prediabetes or type 2 diabetes, and by the time a standard glucose test flags it, a lot of damage is already done.
The reason it slips through: most people never get the right test. A normal fasting glucose and a “fine” HbA1c can hide early insulin resistance completely, because in the early stages your body compensates — it just pumps out more insulin to keep your blood sugar looking normal. The glucose reads fine. The insulin doing the work behind it is running hot.
What insulin resistance actually is
Insulin is the hormone that moves sugar out of your blood and into your cells. When your cells stop responding to it well, your pancreas compensates by making more. Blood sugar stays normal for a while — but only because insulin levels are climbing. Physiologists call this compensatory hyperinsulinemia: the beta cells of the pancreas ramp up insulin output to keep glucose in range (StatPearls / NCBI).
That compensation phase is the important part. It’s where the problem is reversible, and it’s exactly where a plain glucose test tells you nothing.
How common is it — and how many people don’t know
This is the part most people find genuinely surprising:
- About 96 million American adults — more than 1 in 3 — have prediabetes, the stage that follows insulin resistance, according to the CDC’s National Diabetes Statistics Report.
- And more than 80% of them don’t know they have it — roughly 8 in 10 (CDC).
- Insulin resistance is thought to precede a type 2 diabetes diagnosis by 10 to 15 years — a long window in which a standard checkup can keep coming back “normal” (Freeman & Pennings, StatPearls / NCBI).
In other words, the odds that you or someone close to you has early insulin resistance and simply hasn’t been told are not small.
The early signs (before any diagnosis)
Insulin resistance rarely announces itself. But there are patterns worth paying attention to:
- Energy crashes after meals, especially after carbs — sleepy an hour after lunch (a common thread in persistent fatigue)
- Stubborn weight around the midsection that won’t move with the usual effort
- Constant hunger or cravings, particularly for sugar and refined carbs
- Brain fog and afternoon fatigue
- Skin tags or darkened, velvety patches of skin (acanthosis nigricans), often on the neck or armpits
- High blood pressure or a borderline lipid panel (high triglycerides, low HDL)
- For women: irregular cycles or PCOS, which is tightly linked to insulin resistance
Any one of these on its own means little. Several together are worth investigating properly — with the right blood work.
The numbers that actually reveal it
Here’s what to ask for, beyond a basic glucose reading:
Fasting insulin
The single most underused test. Because your body raises insulin before glucose drifts, a rising fasting insulin is often the earliest signal — values above roughly 10–12 µIU/mL can suggest insulin resistance even when glucose is still normal (StatPearls / NCBI). Most labs won’t run it unless you ask.
HOMA-IR
This combines fasting glucose and fasting insulin into a single insulin-resistance score. It’s the practical workhorse marker:
- Below 1.0 — insulin sensitive (ideal)
- 1.0–1.9 — early/mild insulin resistance worth watching
- 2.0–2.9 — significant insulin resistance
- 3.0+ — marked insulin resistance
HbA1c
Your average blood sugar over ~3 months. Useful, but a lagging indicator — it tends to rise only after insulin resistance is well established. Below 5.7% is “normal,” 5.7–6.4% is prediabetes. (Full guide to what HbA1c means.)
Triglyceride-to-HDL ratio
A quick proxy you can calculate from a standard lipid panel. A ratio above ~2 (US units) is a common flag for insulin resistance even when glucose looks fine.
The key insight: no single number tells the story. Insulin resistance shows up in the relationship between markers — a HOMA-IR that’s creeping up while beta-cell output stays high is a very different picture than any one value read in isolation.
What this looks like in practice
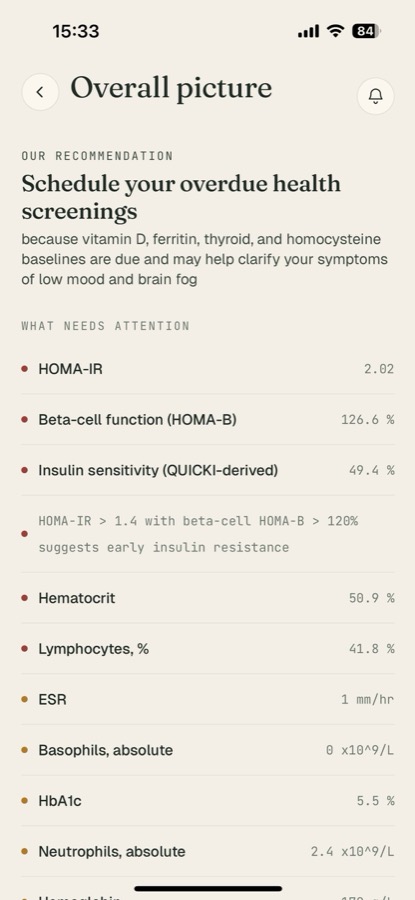
Here’s a real example from Bevita’s “Overall picture” screen. On paper, this person’s glucose and HbA1c (5.5%) both read as normal. But look at what the app surfaces:
- HOMA-IR: 2.02 — into the significant-insulin-resistance range
- Beta-cell function (HOMA-B): 126.6% — the pancreas is working overtime to compensate
- Insulin sensitivity: 49.4% — reduced
The app connects the dots the way a plain lab report can’t: “HOMA-IR > 1.4 with beta-cell HOMA-B > 120% suggests early insulin resistance.” That’s the compensation phase caught in the act — normal glucose, but insulin machinery straining to keep it there. This is precisely the window where changes actually work.
What to do if you suspect it
- Get the right tests. Ask specifically for fasting insulin alongside fasting glucose so a HOMA-IR can be calculated. Don’t settle for glucose alone.
- Look at trends, not single readings. Insulin resistance is a slow drift. One HOMA-IR is a snapshot; three over a year tell you the direction — and direction is what matters.
- Retest after changes. If you adjust diet, sleep, or activity, re-check in ~3 months. Fasting insulin responds faster than HbA1c, so it’s a better short-term feedback marker.
- Talk to a clinician before acting on any of it — these numbers guide a conversation, they don’t replace one.
References
- Centers for Disease Control and Prevention. National Diabetes Statistics Report.
- Centers for Disease Control and Prevention. Prediabetes — Could It Be You?
- Freeman AM, Acevedo LA, Pennings N. Insulin Resistance. StatPearls, National Center for Biotechnology Information (NCBI).
- National Institute of Diabetes and Digestive and Kidney Diseases (NIDDK). Insulin Resistance & Prediabetes.
This article is for education and isn’t medical advice. Discuss your results with a qualified clinician.
Track it with Bevita
Insulin resistance is a story that only makes sense over time, and it lives in the relationship between several markers at once — exactly the thing a stack of PDF lab reports makes impossible to see.
Upload your blood test results to Bevita and it calculates HOMA-IR, beta-cell function, and insulin sensitivity for you, tracks them across every test you add, and flags the early patterns — like a normal glucose sitting on top of a climbing HOMA-IR — before they’d ever show up as a diagnosis. It ties those trends to the symptoms you log, so an afternoon energy crash stops being a random note and becomes part of the picture.
If you’ve ever left a checkup being told everything’s “normal” while still feeling off, this is the layer that was missing. Download Bevita, upload your labs, and see what your numbers have actually been doing.