Most people leave a checkup knowing exactly one thing about their cholesterol: whether it’s “high” or “fine.” But a lipid panel isn’t one number — it’s five or more, and the single number people fixate on (total cholesterol) is actually the least useful of the bunch. Understanding what each one means changes the picture entirely.
The stat most people don’t know
Cardiovascular disease is the leading cause of death worldwide — an estimated 19.8 million deaths in 2022, about a third of all deaths globally (WHO). And a large share of people who have heart attacks have a “normal” total cholesterol. That’s the core problem with judging risk by one number: total cholesterol hides the balance between the particles that raise risk and the ones that lower it. The detail is where the signal lives.
What each number means
- Total cholesterol — the sum of everything. Least informative on its own, because it blends “good” and “bad” together.
- LDL (“bad”) — carries cholesterol into artery walls; higher LDL generally means higher risk. Usually the main treatment target.
- HDL (“good”) — helps clear cholesterol; higher is generally protective.
- Triglycerides — a blood fat that rises with excess sugar, refined carbs, and insulin resistance. High triglycerides are a metabolic red flag.
- Non-HDL cholesterol — total minus HDL; captures all the risk-carrying particles in one number, and many clinicians consider it better than LDL alone.
- ApoB (if tested) — counts the actual number of risk-carrying particles; increasingly viewed as one of the best single markers of cardiovascular risk.
- Non-HDL cholesterol — total minus HDL, so it captures every artery-damaging particle at once, not just LDL. It costs nothing extra and stays reliable when high triglycerides make calculated LDL untrustworthy.
The ratio that punches above its weight
Here’s the free insight hiding in a standard panel: the triglyceride-to-HDL ratio. Divide your triglycerides by your HDL — a raised ratio is one of the best surrogate markers of insulin resistance, outperforming triglycerides or HDL alone (Kim-Dorner et al., NCBI). Thresholds vary by population (studies land anywhere from ~1.5 to 3.0), but a ratio climbing past ~2 in US units is worth attention even when your total cholesterol looks perfectly normal. It ties your lipid panel directly to your blood-sugar and insulin picture, which is why reading these markers together matters.
Why single numbers mislead
A total cholesterol of 195 can look reassuring while hiding low HDL and high triglycerides — a genuinely higher-risk pattern. Conversely, a higher total cholesterol driven by high HDL can be less concerning than it looks. The numbers only mean something in relation to each other, and tracked over time — a single snapshot rarely tells you where you’re actually headed.
What this looks like in Bevita
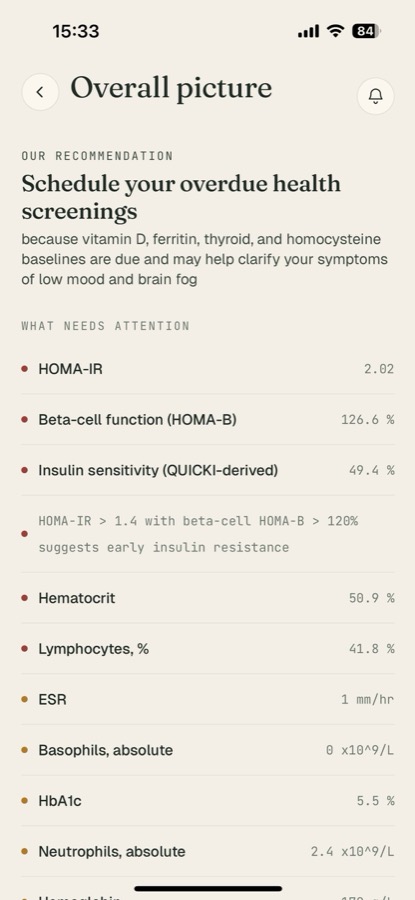
Bevita treats your lipid panel the way it treats the metabolic markers on this “Overall picture” screen — not as isolated values, but read together and interpreted. It calculates ratios like triglyceride-to-HDL for you, flags them against optimal (not just “normal”) ranges, and tracks each number across every test so a slow drift in the wrong direction becomes visible. Instead of “your cholesterol is fine,” you see the actual balance and where it’s trending.
Go deeper on each number: LDL vs HDL — good, bad, and the nuance · high triglycerides and what they mean · ApoB, the more accurate risk marker · the triglyceride-to-HDL ratio.
What to do
- Get the full lipid panel, and ask for the individual numbers — not just “total cholesterol is fine.”
- Calculate your triglyceride-to-HDL ratio — a quick, revealing metabolic check.
- Ask about ApoB or non-HDL if you want a clearer risk picture than LDL alone.
- Track over time — one panel is a snapshot; the trend is the story.
- Talk to a clinician to interpret it against your overall cardiovascular risk.
For keeping the panel somewhere you can actually compare year to year, see our roundup of the best apps for tracking cholesterol.
References
- World Health Organization. Cardiovascular diseases (CVDs).
- Kim-Dorner SJ, et al. Triglycerides-to-HDL cholesterol ratio as a surrogate marker for insulin resistance, NCBI.
- American Heart Association. Cholesterol — About Cholesterol.
This article is for education and isn’t medical advice. Discuss your results with a qualified clinician.
Track your lipids with Bevita
Your cholesterol only makes sense as a full picture — the balance between LDL, HDL, and triglycerides, the ratios, and the trend over time. Upload your labs to Bevita and it reads the whole panel together, calculates the ratios that matter, flags optimal-vs-normal, and tracks every number across tests. Download Bevita, upload your lipid panel, and see what your cholesterol actually means.