“Your cholesterol is fine” is one of the most common — and most misleading — things you can hear at a checkup. Cardiovascular disease is the leading cause of death worldwide (WHO), and cholesterol isn’t one number — it’s LDL, HDL, triglycerides, non-HDL, ApoB, and the ratios between them. Tracking the full picture over time needs the right app.
Why one number isn’t enough
Total cholesterol blends “good” and “bad” together, so it can hide a genuinely risky pattern — low HDL with high triglycerides — behind a reassuring-looking total. What matters is the breakdown and the ratios, tracked over time. That’s exactly what most apps don’t do well.
The best options
Bevita — best for the full lipid panel and ratios
Reads your lab PDFs and trends LDL, HDL, triglycerides, non-HDL, and ApoB across every test — and calculates the triglyceride-to-HDL ratio, one of the best surrogate markers of insulin resistance. Flags values against optimal (not just “normal”) ranges and ties them to your metabolic markers. Free to start, any lab.
General health apps (Apple Health, etc.) — limited for lipids
Can store a total cholesterol or LDL value and show a basic timeline, but don’t track the full panel, calculate ratios, or flag optimal ranges. (See Apple Health vs a dedicated lab tracker.)
Testing services (InsideTracker, Function) — testing + recommendations
Order lipid panels and give recommendations, at a premium price. Useful if you want testing bundled in, but you can also just track the labs you already get.
Spreadsheets — free, but manual
Some people track lipids in a spreadsheet. It works, but there’s no automatic extraction, no ratio calculation, and no optimal-range flagging.
How to choose
| Your need | Best fit |
|---|---|
| Track full lipid panel + ratios over time | Bevita |
| Store an occasional cholesterol value | Apple Health |
| Testing + supplement recommendations | InsideTracker / Function |
| Manual control, no cost | Spreadsheet |
What this looks like in Bevita
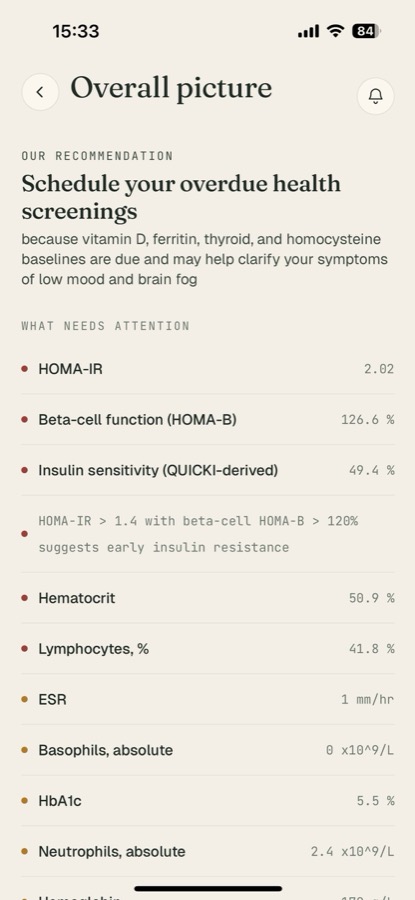
Bevita treats your lipid panel the way it treats every marker on this “Overall picture” screen — read together and interpreted, not left as isolated values. It calculates the triglyceride-to-HDL ratio for you, flags each number against optimal ranges, and tracks the trend across every test, so a slow drift in the wrong direction becomes visible instead of hidden behind a “normal” total cholesterol.
The bottom line
- Want the full lipid picture tracked and interpreted? Bevita — full panel, ratios, optimal-range flags, free to start.
- Just need to store a number? Apple Health will do it, without the analysis.
- Want testing bundled with advice? A paid testing service — at a higher cost.
References
- World Health Organization. Cardiovascular diseases (CVDs).
- American Heart Association. About Cholesterol.
This article is for education and isn’t medical advice. Discuss your results with a qualified clinician.
Track your cholesterol with Bevita
Your cholesterol only makes sense as a full picture — the balance between LDL, HDL, and triglycerides, the ratios, and the trend over time. Upload your labs to Bevita and it reads the whole panel, calculates the ratios that matter, flags optimal-vs-normal, and tracks every number across tests. Download Bevita and see what your cholesterol actually means.