Blood sugar is one of the most important things to track for long-term health — about 96 million US adults have prediabetes and most don’t know it (CDC). But “tracking blood sugar” means different things: daily fingersticks, a continuous sensor, or the lab markers (HbA1c, fasting glucose, fasting insulin) that show the bigger trend. The right app depends on which you’re doing.
The three kinds of blood-sugar apps
- Lab-trackers — read your blood test results (HbA1c, glucose, insulin) and trend them over time.
- Glucose loggers — record daily fingerstick readings, mainly for people with diabetes.
- CGM apps — pair with a continuous glucose monitor for real-time data.
Most people watching metabolic health want the first — the lab-level trend — and that’s where results most often get lost in scattered PDFs.
The best options
Bevita — best for lab-level tracking and early detection
Reads your lab PDFs, tracks HbA1c across every test, and calculates HOMA-IR from fasting insulin and glucose — catching early insulin resistance that a normal HbA1c can hide. Ties results to symptoms and exports a doctor-ready PDF. Free to start, any lab.
mySugr — best for daily glucose logging
A well-designed logbook for people with diabetes doing daily fingersticks — bolus calculator, reminders, reports. Focused on daily management rather than lab-marker trends.
CGM apps (e.g. sensor companion apps) — best for real-time data
If you wear a continuous glucose monitor, these show minute-by-minute glucose and meal responses. Powerful, but sensor-dependent and more than many people need.
General health apps — limited for blood sugar
Apple Health and similar can store a glucose value but don’t calculate derived markers or flag early insulin resistance. (More on that in Apple Health vs a dedicated lab tracker.)
How to choose
| Your situation | Best fit |
|---|---|
| Watching metabolic health / prediabetes | Bevita (lab trends + HOMA-IR) |
| Managing diabetes with daily fingersticks | mySugr |
| Using a continuous glucose monitor | Your CGM’s companion app |
| Want labs + everything in one record | Bevita |
What this looks like in Bevita
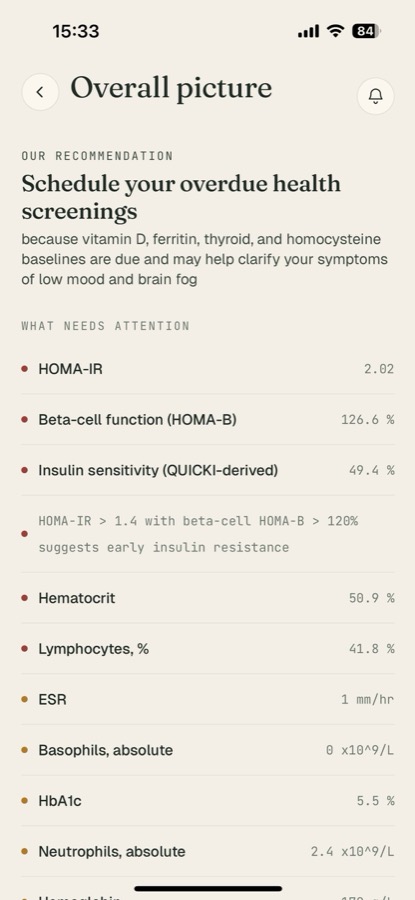
Here’s what a lab-level tracker adds. On this Bevita screen, HbA1c reads a normal 5.5% — but Bevita also calculates HOMA-IR (2.02) from fasting insulin and glucose, flagging early insulin resistance the HbA1c alone would miss. That’s the difference between logging a number and understanding it: the app surfaces the metabolic strain behind a “normal” result and tracks it over time.
The bottom line
- Tracking metabolic health / prediabetes? A lab-tracker like Bevita gives you the HbA1c trend plus the insulin picture behind it.
- Managing diabetes daily? A glucose logger like mySugr fits the day-to-day.
- Want the deepest real-time view? A CGM and its app — if you want the detail and cost.
References
- Centers for Disease Control and Prevention. National Diabetes Statistics Report.
- American Diabetes Association. Understanding A1C.
This article is for education and isn’t medical advice. Discuss your results with a qualified clinician.
Track your blood sugar with Bevita
If you want your HbA1c and blood-sugar markers as a trend — not scattered across lab PDFs — upload them to Bevita. It tracks HbA1c across every test, calculates HOMA-IR, flags early insulin resistance, and ties it to your symptoms. Free to start, any lab. Download Bevita and see what your blood sugar has really been doing.