If you’ve gone looking for an app to make sense of your blood test results, Ornament probably came up. It’s one of the more established players in the lab-tracking space, and for good reason — it does the basics well. But “the basics” is also where the ceiling is, so it’s worth knowing exactly what you get and what you don’t before you commit your years of lab history to it.
The stat most people don’t know
Most adults have blood test results scattered across multiple portals, PDFs, and photos going back years — and can’t actually retrieve or read them as a trend. That’s the problem every app in this category is trying to solve. The differences come down to how far past simple storage each one goes.
What Ornament does well
- Easy upload — photo and PDF recognition pulls values from your results without much typing.
- Organized history — markers grouped by body system, with a timeline for each.
- Color-coded status — a quick green/yellow/red read against reference ranges.
- Clean, approachable design — it’s not intimidating for non-medical users.
For someone who mainly wants a tidy digital archive of their labs, it’s a reasonable pick.
Where it falls short
- Reference range, not optimal range. Like most trackers, it flags values against the wide “normal” range — so a functionally low ferritin or a borderline thyroid can still read as fine. (See reference vs optimal ranges.)
- Limited derived markers. Scores that require combining values — like HOMA-IR for insulin resistance — aren’t its focus.
- Storage over interpretation. It’s better at holding your data than at explaining what the pattern across markers actually means.
- Symptoms live separately. How you feel — fatigue, brain fog — isn’t tied back to the numbers.
What to look for in an alternative
- Derived metabolic markers calculated automatically (HOMA-IR, triglyceride-to-HDL).
- Optimal-range flagging, not just the wide normal band.
- Symptom-to-lab connections — linking fatigue or brain fog to the markers behind them.
- Trends read together, so a normal HbA1c sitting on a rising HOMA-IR doesn’t slip through.
How Bevita compares
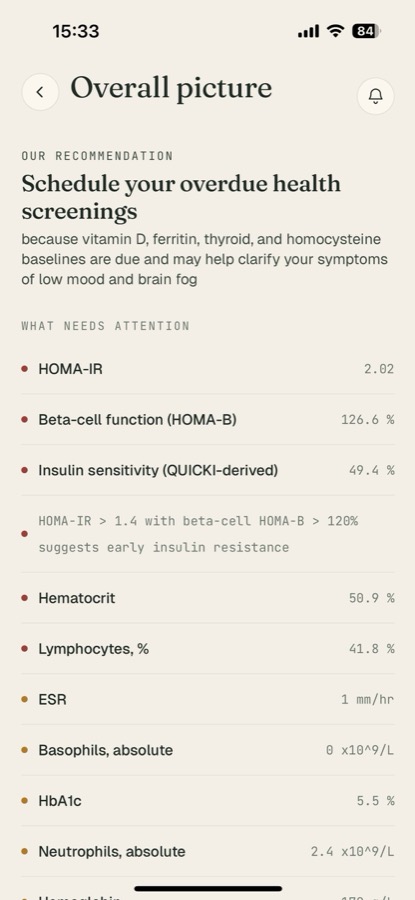
This is where Bevita differs from a storage-first app. On this “Overall picture” screen it isn’t just showing stored values — it’s calculating markers that aren’t on the original report (HOMA-IR 2.02, beta-cell function 126.6%, insulin sensitivity 49.4%), interpreting them in plain English (“suggests early insulin resistance”), and tying the recommendation to reported symptoms of low mood and brain fog.
So the honest comparison: Ornament is a clean, capable place to store and browse your labs. Bevita is built to interpret them — derived scores, optimal-range flags, and symptom connections — which matters most if you’re trying to catch early patterns rather than just archive results.
The bottom line
- Choose Ornament if you want a simple, well-designed archive of your lab history.
- Choose Bevita if you want the app to do the reading — calculate the markers that matter, flag what’s drifting even within “normal,” and connect your labs to how you actually feel.
This article is for education and isn’t medical advice. Discuss your results with a qualified clinician.
Try Bevita
If you’ve outgrown simple storage and want your labs actually interpreted, upload your results to Bevita — it calculates your metabolic markers, flags optimal-vs-normal, tracks every trend, and ties the numbers to your symptoms. Free to start. Download Bevita and see what your bloodwork has really been telling you.